Autonomous penetration testing,
with the controls a real production environment requires.
An AI agent runs end-to-end penetration tests across your whole environment — internet-facing systems, web apps and APIs, cloud (AWS/GCP/Azure), hybrid setups, and internal networks. Your team can approve, override, or take over at any point. Every test ships with a live portal, a programmatic API, and the formal report your organization needs.
Each test is scoped to a defined target and timeframe. You commission the test; the AI agent executes it within the agreed scope and operator mode. The portal and API are live from kickoff onward and remain available for your audit window. The formal report ships at completion. Because the agent runs faster than a comparable human team, retesting and follow-on tests are economical to schedule as part of an ongoing remediation cycle.
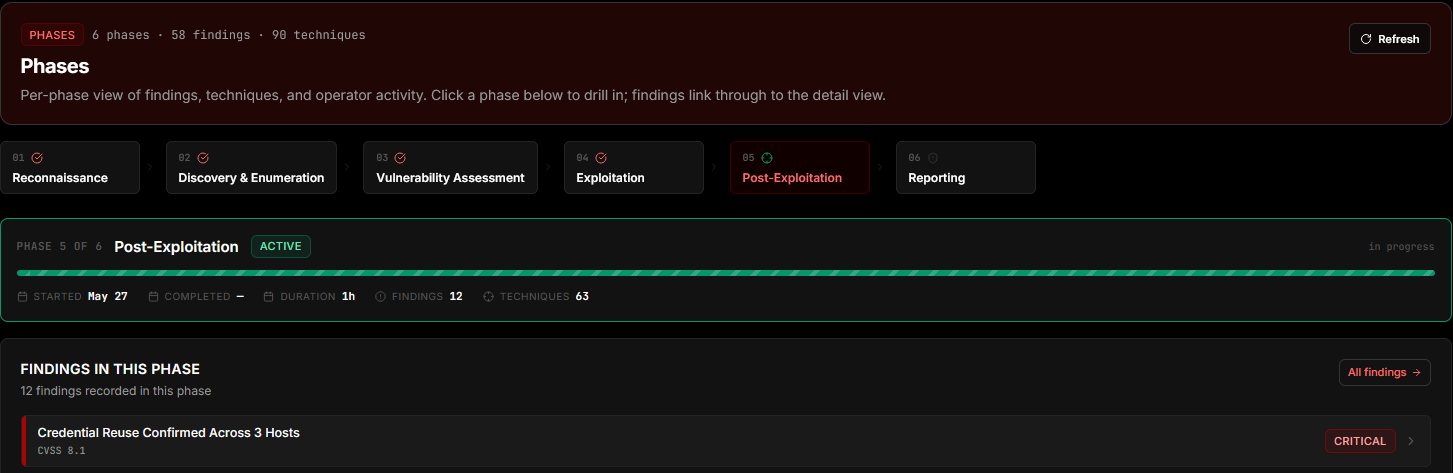
Six phases, each traceable in the portal.
Aligned with PTES — the Penetration Testing Execution Standard, the industry’s standard methodology for how a pentest is structured. Pre-engagement scoping work happens before kickoff; see Engagement Process for that.
Reconnaissance
Outside-in intelligence gathering: passive discovery of exposed services, subdomains, public infrastructure, leaked credentials, and identity sources. Observations appear in the portal with full provenance as they are collected.
Discovery & Enumeration
Active probing of the surface that reconnaissance produced: open-port discovery, service fingerprinting, version detection, share and account enumeration, web-application surface mapping. Each enumerated asset feeds the vulnerability-assessment phase.
Vulnerability Assessment
Each enumerated asset is evaluated against the technique library and the known-vulnerability corpus. Findings are produced for any condition that maps to a real exploitation path, classified by severity, CVSS score, and MITRE / OWASP coverage.
Exploitation
The agent attempts the techniques that vulnerability assessment surfaced. Successful exploits land in the portal as findings with the exact command, response, and captured artifacts that demonstrate the access achieved.
Post-Exploitation
From the established foothold: lateral movement, privilege escalation, persistence assessment, and impact demonstration. Trust chains traversed and credential paths walked are recorded in the attack-path view as confirmed hops.
Reporting
The executive summary and detailed technical report are generated from the same evidence the portal displays. Findings, attack path, MITRE coverage, and compliance impact compose into the formal engagement deliverable.
The full attack surface, covered.
Most agentic pentest tools focus on a narrow slice: build pipelines, source repositories, or public web alone. Useful for spot-checks, but not a substitute for a penetration test that covers your whole environment.
Our platform covers the same surfaces a human-led pentest is expected to cover, with techniques selected and adapted to each environment.
External
Internet-facing perimeter assessments: exposed services, public web and API endpoints, mail and DNS infrastructure, leaked credentials, and identity-surface enumeration.
Web application & API
Authenticated and unauthenticated testing across web applications and REST/GraphQL APIs. OWASP-class issues, business-logic flaws, authorization model defects, and API-specific misconfiguration.
Cloud
AWS, Google Cloud, and Azure environments. IAM and role-chain abuse, exposed storage, compute and container compromise, serverless execution, and cross-account trust exploitation.
Hybrid
Mixed on-premises and cloud environments where lateral movement, identity federation, and trust chains cross network and provider boundaries.
Internal & Active Directory
Assumed-breach and internal network engagements. Kerberos abuse, credential dumping, ACL and delegation exploitation, lateral movement, and domain or forest escalation.
Targeted scope
Engagements scoped to specific assets, business units, or compliance boundaries. The agent operates strictly inside the perimeter your engagement agreement authorizes.
You choose how the agent runs.
Most agentic penetration testing tools have one setting: fully autonomous, with the customer watching from the sidelines. That’s fine for some tests, a non-starter for others. Live customer systems, regulated environments, and change-controlled organizations all demand human oversight on what the agent does.
Our platform offers the full operator spectrum on every test, and you can switch between modes mid-test — start fully autonomous, move down to review-before-exploitation when the test enters sensitive territory, and take manual control on the specific steps that warrant it.
Fully Autonomous
The agent executes the engagement end-to-end within the agreed scope, with no operator intervention required. Suitable for re-runs against known environments, regression testing after remediation, or first-pass engagements where the customer wants the agent to operate freely within its guardrails.
Review before exploitation
The agent enumerates, identifies attack paths, and queues exploitation steps — but pauses for operator approval before executing actions that affect the target. Your team approves, modifies, or declines each step. Useful when production sensitivity, regulated environments, or change-control requirements demand explicit oversight.
Manual with agent-assisted guidance
A human operator from your team or ours drives techniques directly through the platform, with the agent suggesting next steps, providing tooling, and recording evidence. Use it for novel surfaces or sensitive systems where you want a human in the driver's seat with the agent acting as a force multiplier.
Asset Inventory
Every host the agent has touched, classified.
The Asset Inventory view shows every host the agent has discovered or tested, classified by role and compromise state. Filter by role or state, search by host, and click through to the findings tied to each asset.
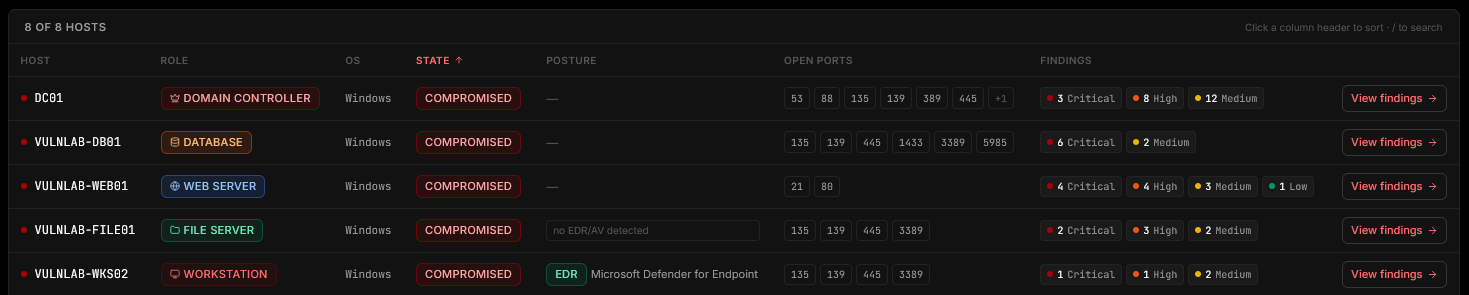
Role classification
Domain Controller, Database, Hypervisor, Web Server, File Server, Workstation, generic Host.
Compromise state
Compromised, Foothold, Enumerated, Untouched — color-coded across the inventory.
Per-host findings
Severity-bucketed finding counts on every row, one click to the detail view.
Findings
Every finding, the moment it lands.
Findings show up in real time as the agent identifies them — severity-classified, CVSS-scored, and tied to the engagement phase that produced them. Each finding carries its evidence: the commands run, the responses captured, the affected hosts, the technique used.
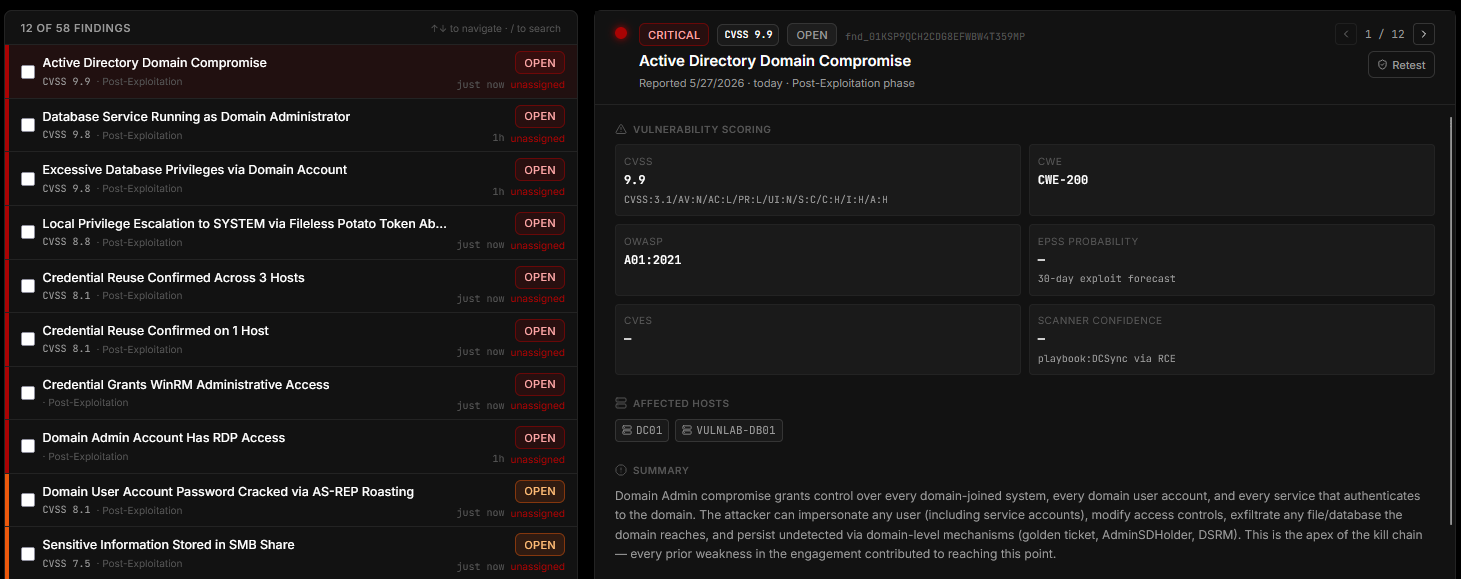
Severity & CVSS
Each finding labeled with severity tier, CVSS 3.1 score, and CWE / OWASP mapping.
Engagement-phase tag
Findings labeled by phase (Reconnaissance, Discovery & Enumeration, Vulnerability Assessment, Exploitation, Post-Exploitation).
Assignment & retest
Assign to a team member, capture remediation notes, retest from the same view.
Demonstrated Attack Graph
Every traversal, mapped.
The Demonstrated Attack Graph view shows the trust and credential paths from the operator’s foothold to your tier-0 assets (your highest-value targets like Domain Admin). Each edge is a confirmed traversal. Click any node to inspect details; hover an edge to see the technique used.
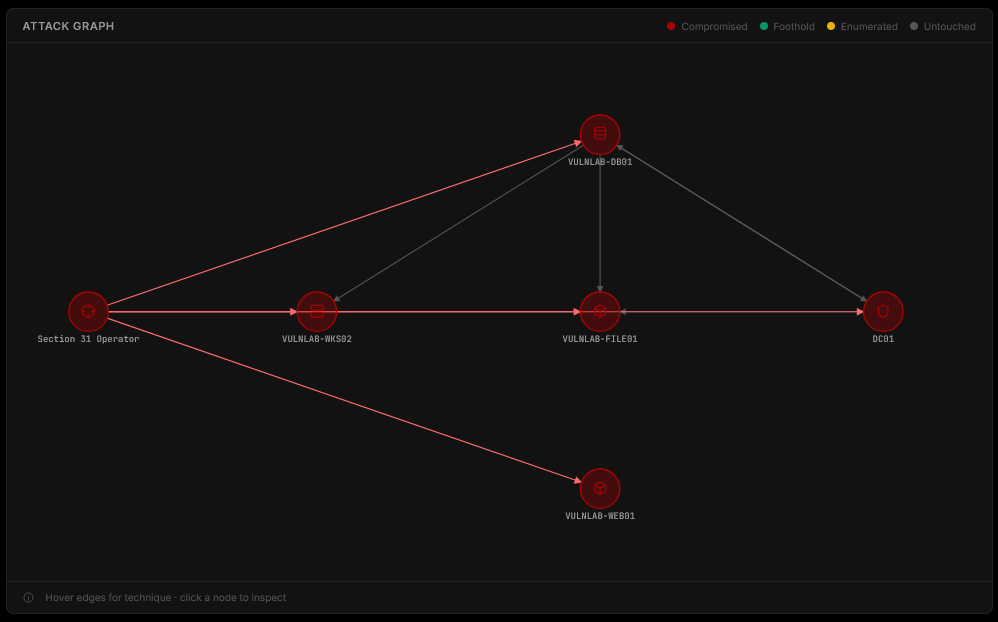
Confirmed traversals
Edges are recorded only when the agent has confirmed the pivot — no theoretical paths.
Node inspector
Click any node to see kind, state, posture, open ports, and tied findings.
Tier-0 reach indicator
Top-of-graph badge showing whether Domain Admin or equivalent tier-0 was reached.
Executive Summary
The answer to "how far did the attacker get?"
The Executive Summary view distills the engagement into the format you would hand to stakeholders, auditors, or customer-assurance teams: assessment narrative, demonstrated business impact, and compliance impact aligned to the frameworks your organization reports against.
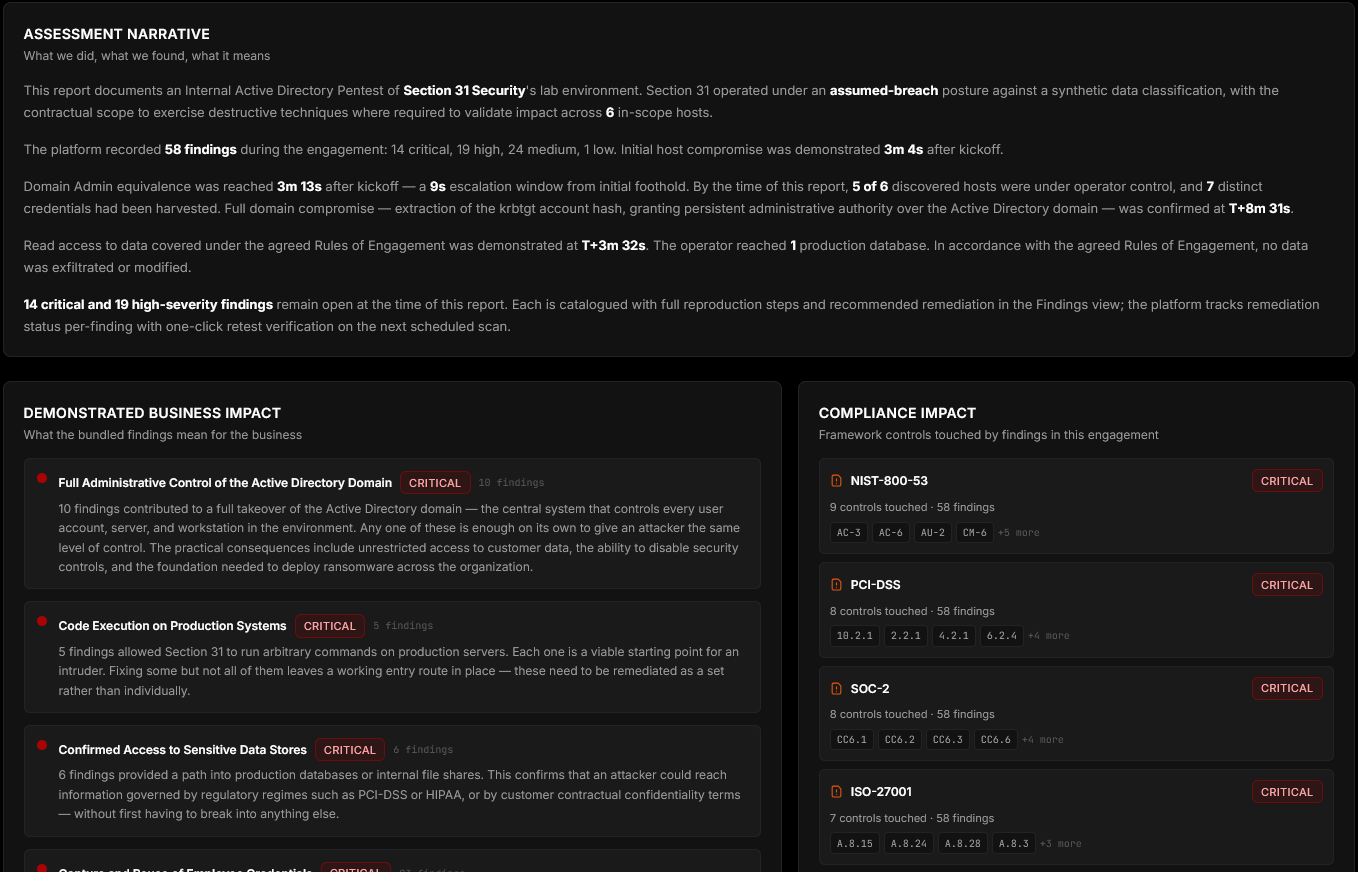
Assessment narrative
Operator-authored summary of what the engagement found, in plain English.
Business impact
Demonstrated impact written against assets and outcomes that matter to the organization.
Compliance impact
Findings mapped to NIST 800-53, PCI DSS, ISO, SOC 2, and HIPAA where applicable.
Reports
Formal deliverables, generated on demand.
Generate and download the formal engagement deliverables whenever you need them. Executive summary and detailed technical report ship as polished PDFs; the same content is also available as Markdown and as structured JSON for ingestion into your own documentation, SIEM, or GRC pipelines.
PDF deliverables
Executive summary, technical report, and compliance mapping as audit-grade PDFs.
Versioned
Every regeneration is saved as a versioned snapshot; previous versions remain downloadable.
Machine-readable
Findings, evidence, and engagement metadata exportable as JSON or Markdown.
Integrations
Connect the engagement to the systems your team already uses.
Push findings to your ticketing system. Stream engagement events to your incident-response channel. Configured once at the organization level; applied to every engagement going forward.
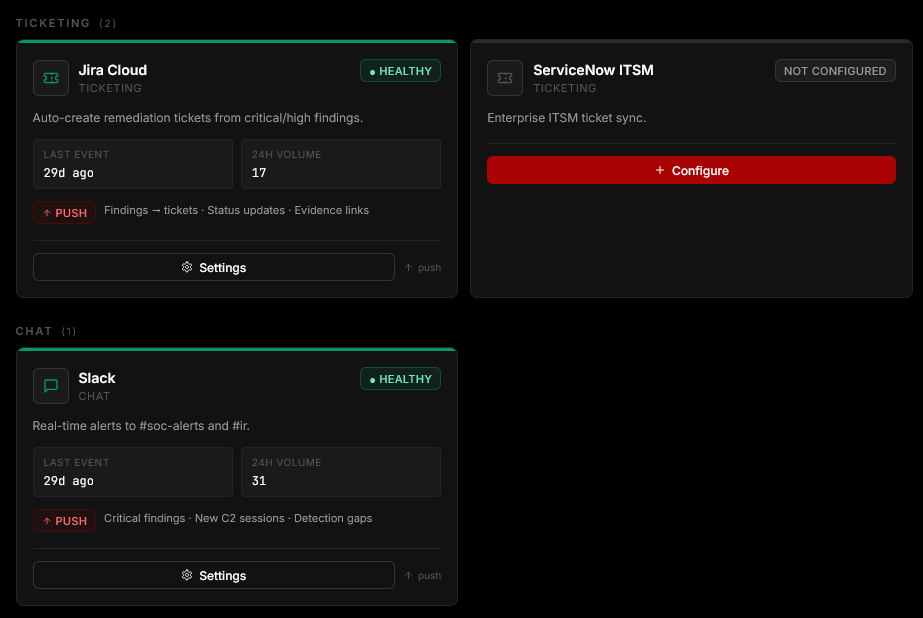
Ticketing
Jira Cloud and ServiceNow ITSM for finding → ticket sync with full evidence linked. More tracker integrations on the roadmap.
Chat
Slack channels for real-time alerts on critical findings, new C2 sessions, and detection gaps.
Health & volume
Per-integration health, last-event timestamp, and 24-hour volume visible from a single config view.
Coverage, mapped automatically.
Every technique the agent exercises is recorded against MITRE ATT&CK and OWASP — the two industry-standard catalogs of attacker behavior and application security risks. Each technique gets one of three states: Confirmed (executed and demonstrated), Attempted (tried but unsuccessful), or Observed (recognized as present but not exercised). All auditable, exportable, and comparable across tests.
Engagement data, available to your systems.
A documented REST API for programmatic access to your test data, operator-mode transitions, and the same actions your team takes through the portal.
Programmatic access to engagement data
Findings, evidence, MITRE and OWASP coverage, attack-path graph data, and engagement metadata are exposed via a documented REST API. Suitable for ingestion into a security data lake, internal reporting tooling, or downstream automation.
Automate retest cycles
Schedule retests programmatically when remediation lands in your environment — for example, from a CI hook, a deployment pipeline, or a change-management workflow — and consume the validation result in the same automation.
Drive operator modes from your tooling
Initiate engagements, switch between operator modes, approve queued exploitation steps, and surface engagement state into your team’s existing dashboards or paging systems.
Integrate with your stack
Wire engagement data into SIEM, GRC, ticketing, and notification systems at the level of granularity your team requires.
What the agent does
- Plans the engagement against the agreed scope, selecting which surfaces to enumerate and which techniques to attempt.
- Adapts technique selection based on the state of the engagement; reconnaissance results inform initial-access attempts; successful access shapes lateral movement.
- Collects evidence — commands, responses, screenshots, artifact captures — and ties each to the technique that produced it.
- Maps the attack path and assigns MITRE ATT&CK and OWASP coverage as the engagement progresses.
- Runs in whichever operator mode the test is configured for. Yields to human approval or direct control as required.
Boundaries and oversight
- The agent operates strictly inside the scope authorized in the engagement agreement, with hard guardrails on out-of-scope assets.
- High-impact actions gate on human approval when the engagement is configured for review-before-exploitation, and are never executed unattended in production-sensitive contexts.
- Engagement reports distinguish actions executed autonomously from steps reviewed or driven by an operator, so the audit trail is complete.
- The platform supplements your security team. Response and remediation remain owned by your organization.
See the platform on a representative engagement.
A walkthrough of a complete test — portal, API, operator modes, and report — against a staged environment. About thirty minutes.